.png?height=120&name=rockcontent-branco%20(1).png)
Slideshows can be an effective way of engaging readers. View how many times your slideshows were viewed in aggregate and on average by reviewing Slideshow Metrics.
Navigation
Dashboard > Any Live Event > Reporting > Analytics
Permission Level
Any
To access your slideshow metrics:
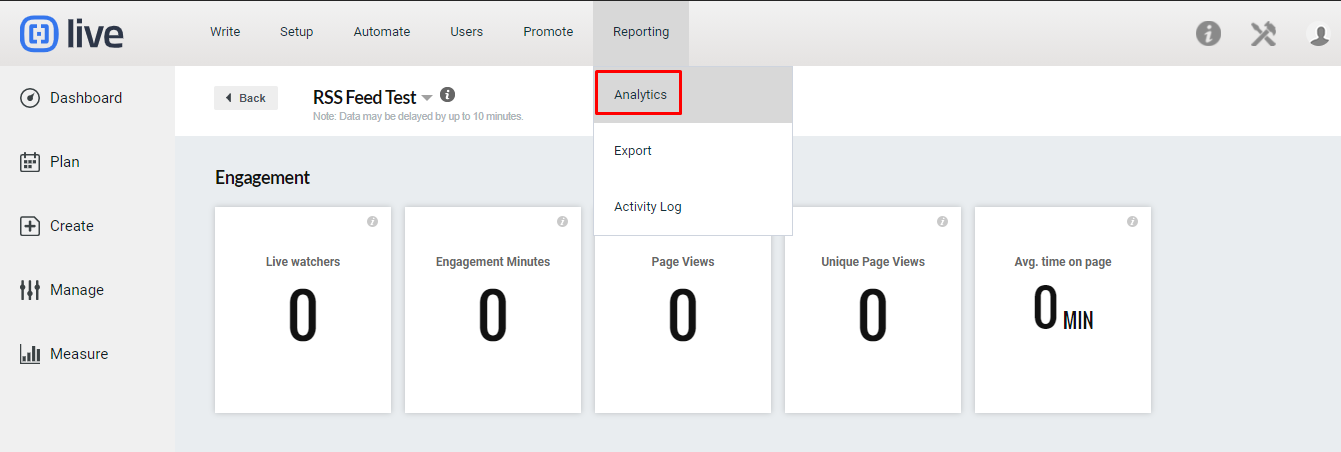
From within your stream, navigate to Menu > Reporting > Analytics at the top of your event page. This will take you to your event’s Statistics page.
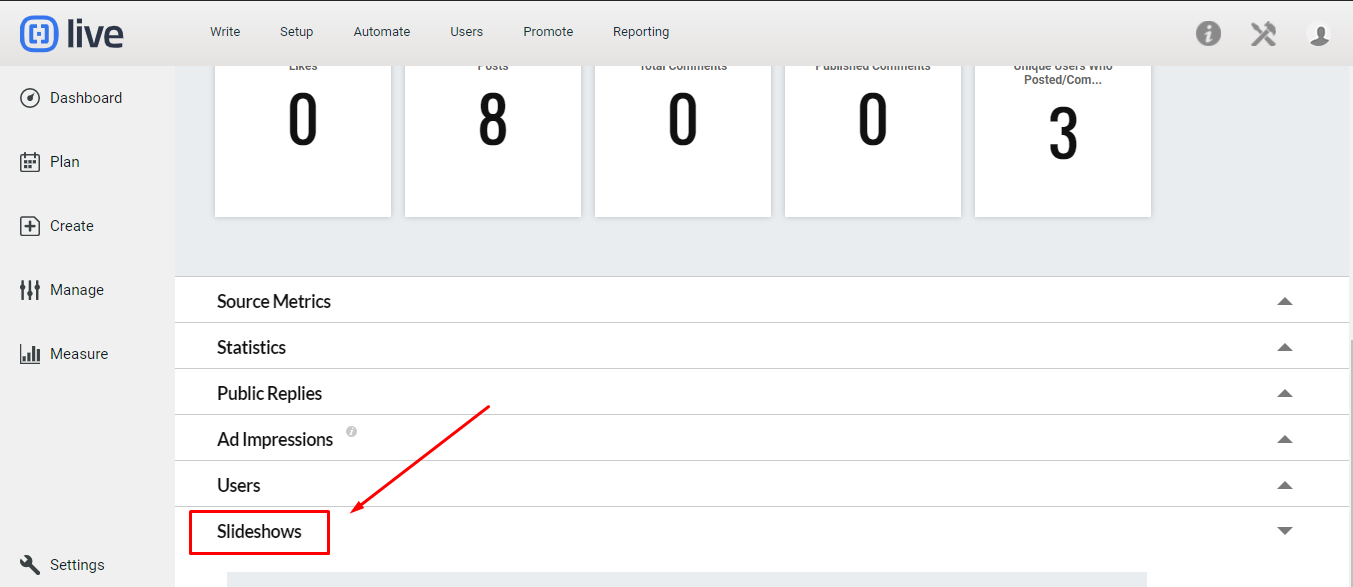
Scroll down to the Slideshow tab in the menu of metrics at the bottom of your page to view your event’s slideshow metrics. The following Slideshow metrics are available:
- Last Edited: The most recent edit made to a slideshow.
- Post ID: A unique identifying number specific to your slideshow.
- Preview: Click the magnifying glass icon to preview your slideshow.
- Total Views: The number of times your slideshow was viewed. Note: a slideshow on page 2 of your event would only be counted in your slideshow metrics if a user loads the second page of your event in their browser.
- Total Clicks: The number of times the next or previous slide arrows were clicked in a slideshow.
- Average Clicks: An average number of clicks each slideshow received. This number is calculated by dividing the total views by the total clicks.
Note: There is a 10-15 second delay in reporting slideshow metrics.
Accessing your Slideshow Metrics via your Whitelabel Site
If you are using a white label, you can access the original slideshow post by pasting the Post ID at the end of the event white label URL:
(e.g., http://live.yourdomain.com/Event/Your_Event_Title/PostID)
Please contact your Live account representative for more information about our Enhanced Metrics Package.